The Illusion of Oversight: When Your Monitoring Stack Becomes a Stage Set
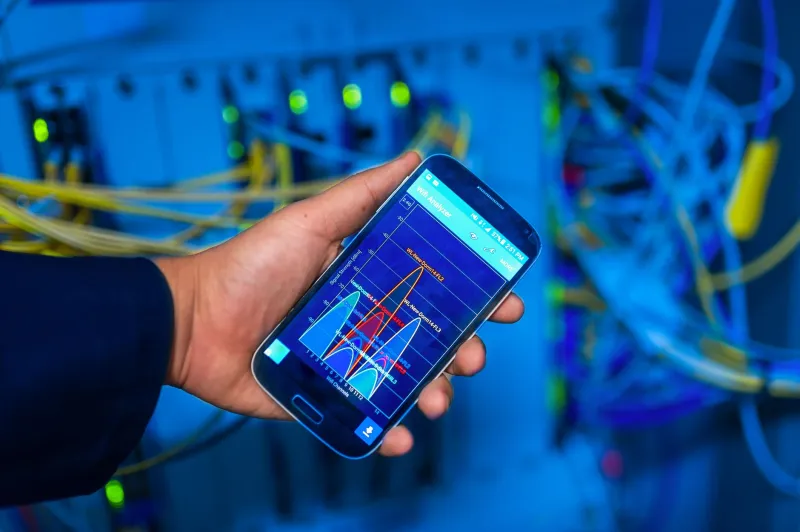
The dashboard looked extraordinary. Dozens of panels. Color-coded health indicators. Alert thresholds configured down to the decimal. The team had invested weeks building it, and when they walked investors or new hires through the operations center, it projected exactly the kind of engineering maturity that growing startups aspire to communicate.
Then the database connection pool silently exhausted itself on a Friday evening. Requests began timing out. Users churned through a broken checkout flow for forty-seven minutes before a customer support ticket — not an alert — surfaced the problem.
Every metric on the dashboard was green.
This is monitoring theater: the construction of observability infrastructure that performs the function of oversight without actually providing it. It is one of the most expensive forms of false confidence available to a technology startup, and it is remarkably common.
Why Dashboards Lie
The fundamental problem with monitoring theater is not technical incompetence. Most of the teams that build it are technically capable. The problem is measurement selection — choosing what to watch based on what is easy to instrument rather than what is likely to fail.
CPU utilization is easy to graph. Memory consumption is easy to graph. Request count is easy to graph. These metrics are not useless, but they are also not sufficient. They describe the health of the infrastructure layer while frequently missing the failures that actually affect users: degraded third-party API responses, silent data corruption, partial transaction failures that complete without error codes, queue backlogs that grow slowly until they do not.
There is also the alert threshold problem. A team sets thresholds based on historical baselines during a period of normal operation. Those thresholds feel conservative and responsible. But they are calibrated to detect deviations from a baseline that may itself be unhealthy, and they are often tuned downward over time as alert fatigue produces a culture of dismissal. When real anomalies occur, they either do not cross the threshold or they are lost in the noise of alerts that have trained the team to acknowledge and close without investigating.
The result is a monitoring system that is technically functional and operationally misleading.
The Alert Fatigue Spiral
Alert fatigue deserves specific attention because it transforms monitoring from a passive liability into an active one.
The pattern is consistent across organizations of different sizes and maturity levels. A new monitoring configuration is deployed with aggressive thresholds intended to catch everything. Within days or weeks, the volume of alerts — many of them non-actionable — becomes overwhelming. Engineers begin acknowledging and closing alerts without investigation, not out of negligence but out of rational adaptation to a signal that has become noise.
Over time, the threshold gets raised to reduce volume. Then raised again. Then specific alert categories get muted because they are known to be noisy. The monitoring configuration that began as a comprehensive safety net has been quietly pruned into something that only catches the most dramatic failures — and sometimes not even those.
The insidious dimension of this spiral is that the dashboard still shows a full configuration. The alert rules are still there. The channels are still connected. From the outside — and from the inside, if nobody has recently audited the suppression rules — the system appears operational. The theater continues.
What Comprehensive Monitoring Actually Requires
The antidote to monitoring theater begins with a shift in measurement philosophy: instrument the user experience, not just the infrastructure.
Synthetic transaction monitoring — automated probes that simulate real user workflows and measure their success or failure end-to-end — catches a category of failures that infrastructure metrics entirely miss. If the checkout flow is broken, a synthetic transaction that attempts to complete a purchase will fail. It does not matter whether CPU utilization is normal. The failure is visible.
Error budget tracking, borrowed from site reliability engineering practices, provides a different kind of visibility. Rather than asking whether individual metrics are within threshold, it asks whether the system is meeting its reliability commitments over time. This framing surfaces slow degradation that point-in-time metrics obscure.
Distributed tracing, while operationally more complex to implement, enables failure attribution at a level of precision that aggregate metrics cannot provide. When a request fails, a trace shows where in the call chain it failed, what the latency distribution looked like at each hop, and which downstream dependency contributed to the problem. This is not a luxury for late-stage companies — it is the difference between a forty-seven minute outage and a five-minute one.
Log aggregation with structured query capability is similarly underutilized in early-stage companies. The instinct is to log everything and search when needed. The more useful posture is to log with intent — capturing the business events and error conditions that matter most — and to build alert logic on top of log patterns rather than relying exclusively on metric thresholds.
The Organizational Dimension
No monitoring architecture survives contact with an organization that has not built the habits to support it.
The most technically sophisticated observability stack fails if the on-call rotation has been conditioned to treat alerts as background noise. It fails if post-incident reviews do not include an explicit question about whether the monitoring system detected the failure before users did. It fails if the team building dashboards has never participated in an incident response and does not understand what information is actually needed in the moment of crisis.
Startups that take monitoring seriously build it into their incident review culture. After every significant failure — regardless of customer impact — they ask the same questions: What did our monitoring show? What did it miss? What would we need to have seen this earlier? The answers to those questions, accumulated over time, produce a monitoring system that reflects actual failure modes rather than theoretical ones.
From Theater to Practice
The transition from monitoring theater to genuine operational visibility does not require a complete rebuild. It requires honesty about what the current system actually detects, followed by deliberate investment in the gaps.
Start with a failure mode inventory. Document the ways your system can fail — not the ways your infrastructure can fail, but the ways your users can experience degradation. Map each failure mode to an existing alert or monitoring signal. Where no signal exists, build one. Where a signal exists but has historically been suppressed or ignored, investigate why.
The goal is a monitoring posture that your team actually trusts — one that, when it is quiet, means something, and when it fires, demands attention. That trust is earned incrementally, through the disciplined work of making the system honest. The stage set comes down. The real work begins.